
Data reliabilityKnowing what you are looking at
Market data is only useful when you know its source, its freshness and its limits.
Volwick uses status indicators to separate available information, stale data and unsupported features. Before reading a level or a move, always check the data status.
- Click the dot next to the instrument, in the top bar.
- WHERE THE WALLS COME FROM opens: read the source of the levels, the metric, the number of strikes, the expirations included, the book time and how long ago it was published.
- If an amber notice appears, read it before any level: it means the book is not the one for the current session.
- Use REFRESH WALLS to reload the book.
- In the panes below the chart, check the freshness indicators: in CDI the dot is green under 30 seconds, yellow up to 3 minutes, red beyond; in Flow the header shows how long ago the last data arrived.
The live box, opened on the evening of 13 October, three hours after the regular session closed. ES was still trading; the dealer book was the one published at the close.
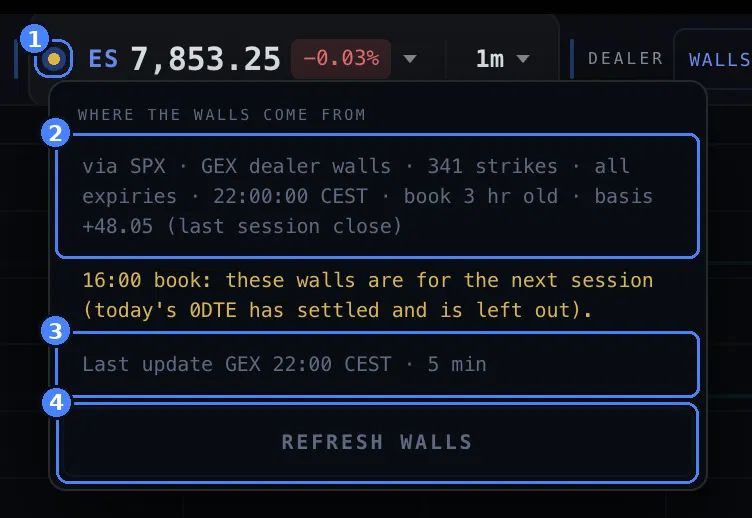
- The dot. Amber: the price feed is live, but the Walls come from an older book. It is green when the book is under 30 minutes old, and gray when the price feed is not live: the market is closed, or the connection is being restored. Click it to open the box.
- Source and time. via SPX · GEX dealer walls · 341 strikes · all expiries · 22:00:00 CEST · book 3 hr old: the levels come from the SPX book published at the 16:00 ET close, built on 341 strikes and all expirations, 3 hours earlier. basis +48.05 (last session close) is the gap between future and index used to map SPX strikes onto the ES scale, as it stood at the close: the SPX 7800 strike becomes the ES 7848.05 level. During regular hours the line also shows the two prices the basis comes from, for example basis +48.24 (ES_F 7858.50 − SPX 7810.26 at 15:43:55 ET): ES minus SPX gives the basis, to the cent.
- Last update. Last update GEX 22:00 CEST · 5 min: the book on screen, with the time since the last check for a newer one.
- REFRESH WALLS. Reloads the book without reloading the page.
How to read it. The book is the one from the close: the Walls on the chart are a reference for the next session, not positioning right now. The dot says so in color and the amber notice under the line says it in words: 16:00 book: these walls are for the next session (today's 0DTE has settled and is left out). After midnight ET the same book is no longer today’s, and a red notice is added, for example Stale: showing the 2026-10-13 book, not today's. When the new session’s first book arrives the dot turns green again and the Walls describe positioning at that moment.
Common mistakes
- Reading a Wall without considering the gamma regime. The same level can mean something different in positive and negative gamma.
- Confusing CVD and CDI. The first observes trades in the underlying, the second 0DTE options activity.
- Reading a white bar as a reversal signal. It marks a liquidity event: compare it with the levels and with price behavior.
- Looking for Block Prints on VIX or QQQ. It is not available. On SPX the ribbon is the ES tape shown at SPX prices.
- Giving every Wall the same weight. Levels beyond the Top 10 generally carry marginal exposure.
- Treating stale data as live. Always check the book dot and the data age in the panes.
- Reading levels in the first minutes after the open without checking they are stable. At the open the map can update quickly.
Five principles to remember
- A Wall’s color is a classification, not a buy or sell signal.
- The same Wall can mean something different depending on the gamma regime.
- A green dot means no known problem, not guaranteed complete data.
- A hollow price tag means the feed has stopped: the data is not live.
- One data point is not enough: look for several independent pieces of information converging on the same area.
- Before reading a level or a move, always check the data status.
- Stale data must not be read as live data.