
What are Dealer Walls?
Dealer Walls are price levels derived from dealer exposure in the options market.
When exposure is particularly high, dealer hedging can influence how the underlying behaves. Volwick identifies these concentrations and draws them directly on the chart.
A Wall is not a traditional support or resistance. It is a level built from options exposure data.
How to use it
- Find the Walls closest to price and their classification.
- Check the gamma regime (next chapter): the same Wall can mean something different.
- Watch how price and flow behave as price approaches the level.
- Give more weight to areas where the Wall lines up with other data, such as a Block Prints key level.
ES, morning of 9 October. The main Wall of the day, read on the chart and in its card.
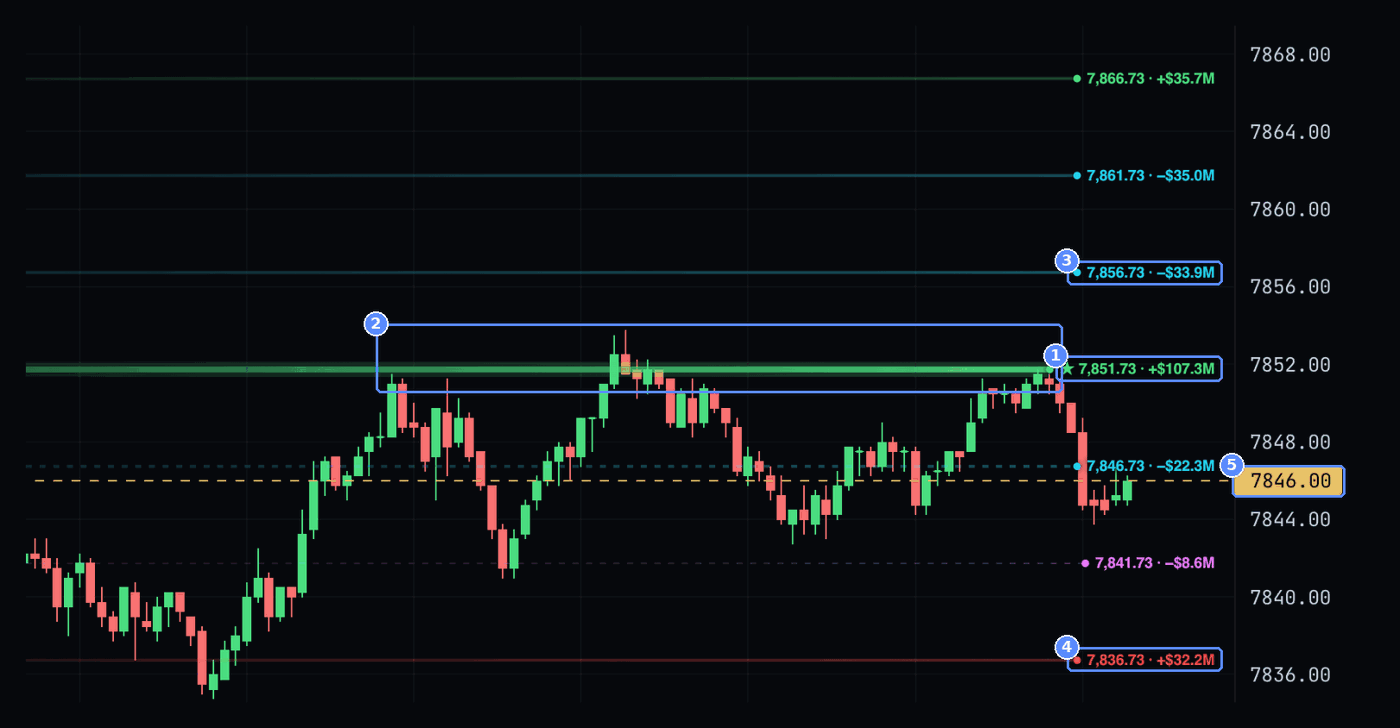
- The main Wall. ★ 7,851.73 · +$107.3M: the star marks the Wall with the highest exposure among those drawn. Green, so call long gamma. It is about three times the next Wall.
- Tests of the level. At 11:00, 11:18 and 11:58 price reached the Wall and was rejected. At 11:18 it went about a point and a half above it, then fell back below within a few minutes.
- Above the Wall. 7,856.73 · −$33.9M and 7,861.73 · −$35.0M: two cyan Walls, call short gamma.
- Below price. 7,836.73 · +$32.2M: a red Wall, put long gamma, the nearest support among those drawn.
- Price. 7846.00, 6 points under the main Wall after the last rejection.
Hovering the starred Wall opens its card:
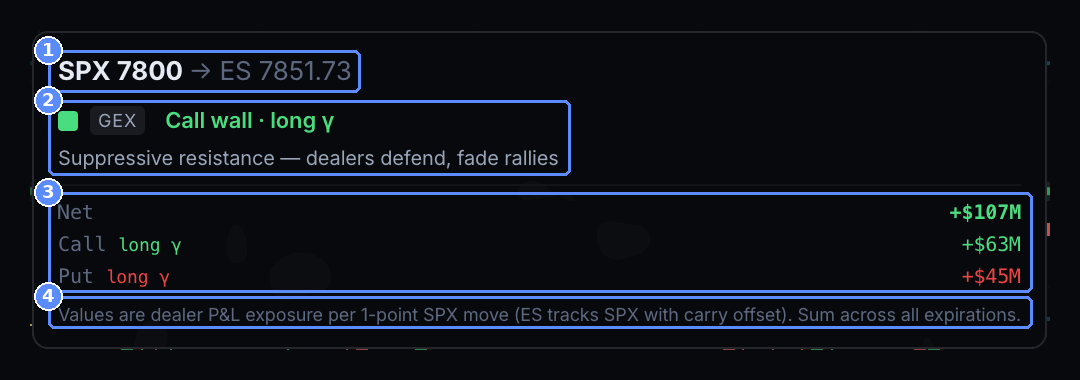
- Strike and price. SPX 7800 → ES 7851.73: the SPX strike the level comes from and the matching ES price.
- Classification. GEX · Call wall · long γ, Suppressive resistance: a resistance where dealer hedging tends to sell rallies.
- Exposure. Net +$107M: call long γ +$63M and put long γ +$45M. Both parts have the same sign and add up.
- Unit. Dealer P&L per 1-point SPX move, summed across all expirations.
The card of the cyan Wall just above describes the opposite effect:
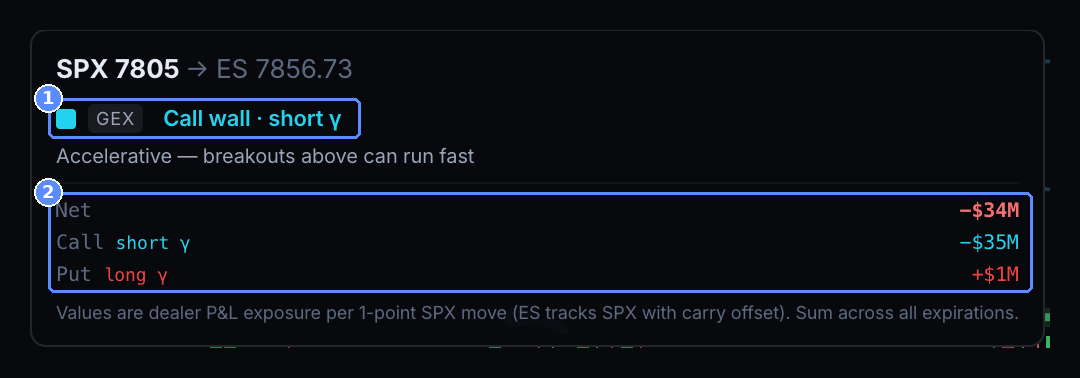
- Classification. Call wall · short γ, Accelerative: above this level a breakout can run fast.
- Exposure. Net −$34M, almost all from short γ calls (−$35M).
How to read it. 7,851.73 acted as resistance all morning: three tests, three rejections. Above it sit short gamma Walls: if price settled above the main Wall, hedging could go with the move instead of slowing it. The Wall does not tell you whether the level will hold: at 12:08 price was already at 7,852.75, above the Wall. A break needs confirmation from the flow, meaning Block Prints and CVD.
The four colors
Reading the label
Hovering a Wall opens its card: the SPX strike and the matching ES price (SPX 7,750 → ES 7,801.75), the classification (Call wall · long γ), the effect description (Suppressive resistance) and the net value split between calls and puts. Values show dealer exposure per 1-point SPX move, summed across the selected expirations. The ES price is the SPX strike plus the basis, placed on the nearest price ES trades at (steps of 0.25): the label, the card and Market Intelligence show the same number.
Reading intensity
A Wall’s importance is shown four ways: line thickness (1 to 4 pixels), opacity, dashing for weaker levels, and a left-to-right fade that is strongest at the current price. The dot in the label lane always shows the full color.
Walls are selected by combining the size of the exposure with proximity to price: the search starts about 1.5% above and below price and extends up to 5% if needed. That keeps a very large but distant strike out of the top spots.
Top 5 shows the main levels. Top 10 adds context. Beyond the tenth level exposure is generally marginal.
METRICWhat the Walls measure
EXPIRYWhich expirations to include
0DTE includes only options expiring today. This week and This month extend the horizon, All includes expirations out to about 60 days. In the menu each row shows the number of strikes included and the dates covered: a low number produces few Walls.
WHERE THE LEVELS COME FROM
On ES and MES the Walls come from the SPX book, shifted by the price difference with the future (the basis, for example offset +51.86) and placed on the nearest ES price, in steps of 0.25. On VX they come from the VIX book at the strike values, with no shift. On SPY, QQQ, NQ, RTY, GOLD and BTC they are estimates based on open interest, not a dealer book, and the Wall card says so. On NQ, RTY, GOLD and BTC each level is the fund strike converted to the future’s price and placed on the future’s own step (0.25 on NQ, 0.10 on RTY and GOLD, 5 on BTC), and the card shows the strike it comes from, for example QQQ 706 → NQ 29,212.75.
- A Wall’s color is its classification, not a buy or sell signal.
- A red Wall does not automatically mean down, a green Wall does not automatically mean up.
- To read it, consider the current price, the gamma regime and the other available data. A green Wall, for example, can also sit below price.