
How the read changes through the day
The different components of dealer exposure can carry more or less weight depending on the time of day.
This playbook helps you see which data to watch in the main phases of the US session.
9:30 – 10:30 ETThe open
Priority: structure and gamma. At the open the market can see large swings in volume and volatility.
Watch:
- The gamma regime.
- The main Dealer Walls.
- How price behaves near the levels.
- The first confirmations from the flow.
10:30 – 14:30 ETMid-session
Priority: price behavior and confirmations.
- Compare moves with the exposure levels.
- Check whether the flow confirms the move or shows divergences.
14:30 – 16:00 ETInto the close
Priority: charm, expirations and changes in exposure. As the close approaches, the passage of time can change the delta of expiring options faster.
- The CEX metric.
- The Charm map.
- How the main levels evolve.
Which markets it applies to
The phases above follow the US index options session. The playbook applies in full to SPX, ES and MES, where there are dealer books, 0DTE options and every pane. On other markets it needs adapting:
Three real moments on ES show how what is worth watching changes.
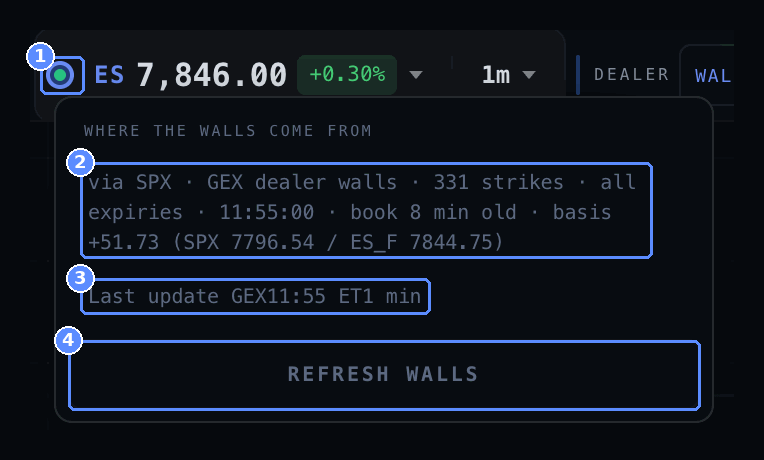
Regular hours9 October, 12:05 ET
The book is 8 minutes old and the dot is green: the levels describe positioning right now. With the following books the basis changed several times and the main ES Wall moved from 7,851.73 to 7,850.88 and then to 7,851.54, always from the same SPX 7800 strike.
Into the close8 October
After 15:55 ET the Gamma map turned amber at the top and at 15:59 a cluster of 20 blocks for 3,200 contracts formed near 7,817. After 16:00 the book becomes 16:00 BOOK · NEXT SESSION EXPIRY: the day’s 0DTE options have expired and are excluded.
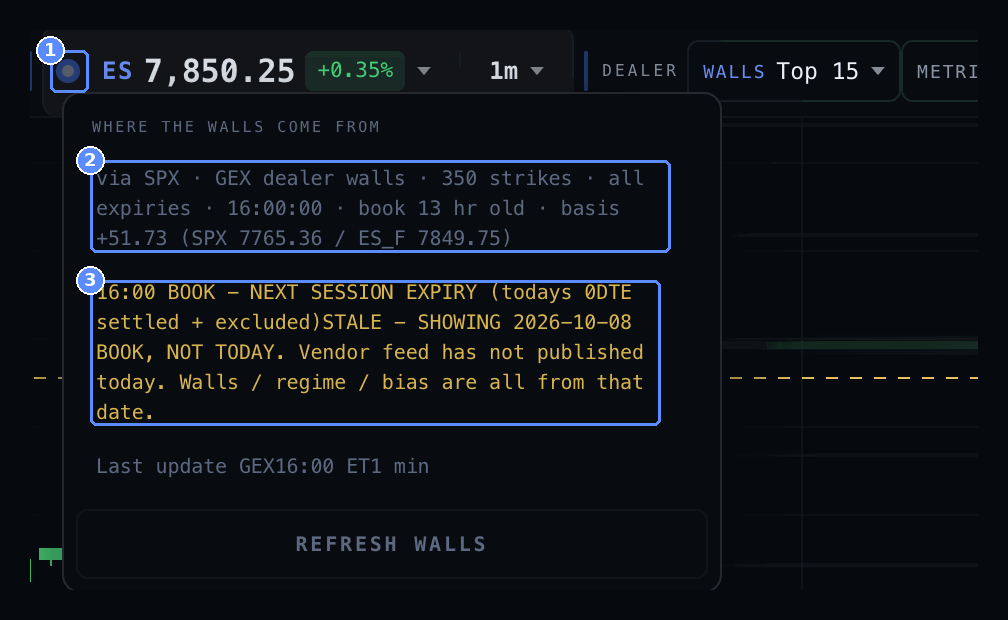
Overnight9 October, 05:10 ET
The Walls are still those from the previous day’s 16:00 book and the box says so with two notices: 16:00 BOOK · NEXT SESSION EXPIRY and STALE · SHOWING 2026-10-08 BOOK, NOT TODAY. CDI and Flow have no 0DTE data yet.
How to read it. During regular hours the book updates several times: check the levels again when it changes, because the basis moves too. Into the close exposure and activity change quickly and it is the time to watch the map and levels more often. Outside the session the levels remain a reference from the previous day and the 0DTE options panes have no data yet.
When each metric can be most useful
| METRIC | PHASE | WHAT IT OBSERVES |
|---|---|---|
| GEX · gamma | whole session | where hedging can dampen or amplify moves |
| Vega and Volga maps | the open and macro news | how hedging reacts to changes in implied volatility |
| CEX · charm | into the close | the effect of time on the delta of expiring options |
- Times indicate when a metric can become particularly relevant, not when the market must behave in a certain way.
- The playbook applies in full to SPX, ES and MES; on other markets it needs adapting.