
How to read the market
How to combine Dealer Walls, Block Prints, CVD and Market Intelligence when reading the same level.
Each Volwick feature answers a different question: where exposure concentrates, what is happening in the trades, whether the flow confirms the move, how positioning is summarized. In this chapter you learn to combine them on the same level, with an example built entirely on live data.
- Check the data. Open the dot: book from the current session or the previous one?
- Find the levels. With WALLS Top 5 find the Walls nearest to price and read color and exposure.
- Read the context. Look at the color of the Walls around price and at Dealer positioning: are dealers long or short gamma in that area?
- Watch the flow. Near the level turn on Block Prints and CVD: is there real activity? On which side? SPX has no CVD and VIX has no flow data: for this step use ES or MES.
- Compare. Open Market Intelligence: do the Key strikes match the Walls? Which scenario is highlighted? Where is the invalidation?
Four reads of the same morning: ES, 9 October 2026, between 10:50 and 12:18 ET, during regular hours. All values come from the screenshots in the previous chapters.
Example 1
Price reaches a Dealer Wall. Between 11:00 and 12:05 price reaches ★ 7,851.73 · +$107.3M three times, a green call long gamma Wall, and is rejected. What it tells you: the highest concentration of exposure on the map, classified as resistance. It does not tell you how long it will hold.
Example 2
Block Prints activity concentrates near a level. Six institutional blocks for 1,177 contracts accumulate at ★★ 7845.00, including the 484 contract mega block at 10:52. Price comes back at 11:35 and 11:58 and bounces. What it adds: under the dealer resistance there is a support built by real trades.
Example 3
CVD shows a divergence. At 10:52 price rises from 7,838 to 7,850 while CVD falls from about +500 to about −2,700 contracts. How the read changes: aggressive selling failed to push price down. Together with the mega block in the same minute, the break above 7,845 looks supported by larger buyers.
Example 4
Market Intelligence describes positioning and scenarios. At 12:06 the panel shows Neutral with MEDIUM conviction, wall above 7,852 one point from price, scenario Between walls. Past the wall above absorption stops and the next wall up is at 7,857. How to compare it: the panel confirms the resistance and tells you what changes if it gives way.
What happened next. Shortly after 12:10 price moved above 7,851.73 and by 12:18 it was at 7,855.75, right under the cyan Wall at 7,856.73: the block named by Market Intelligence.
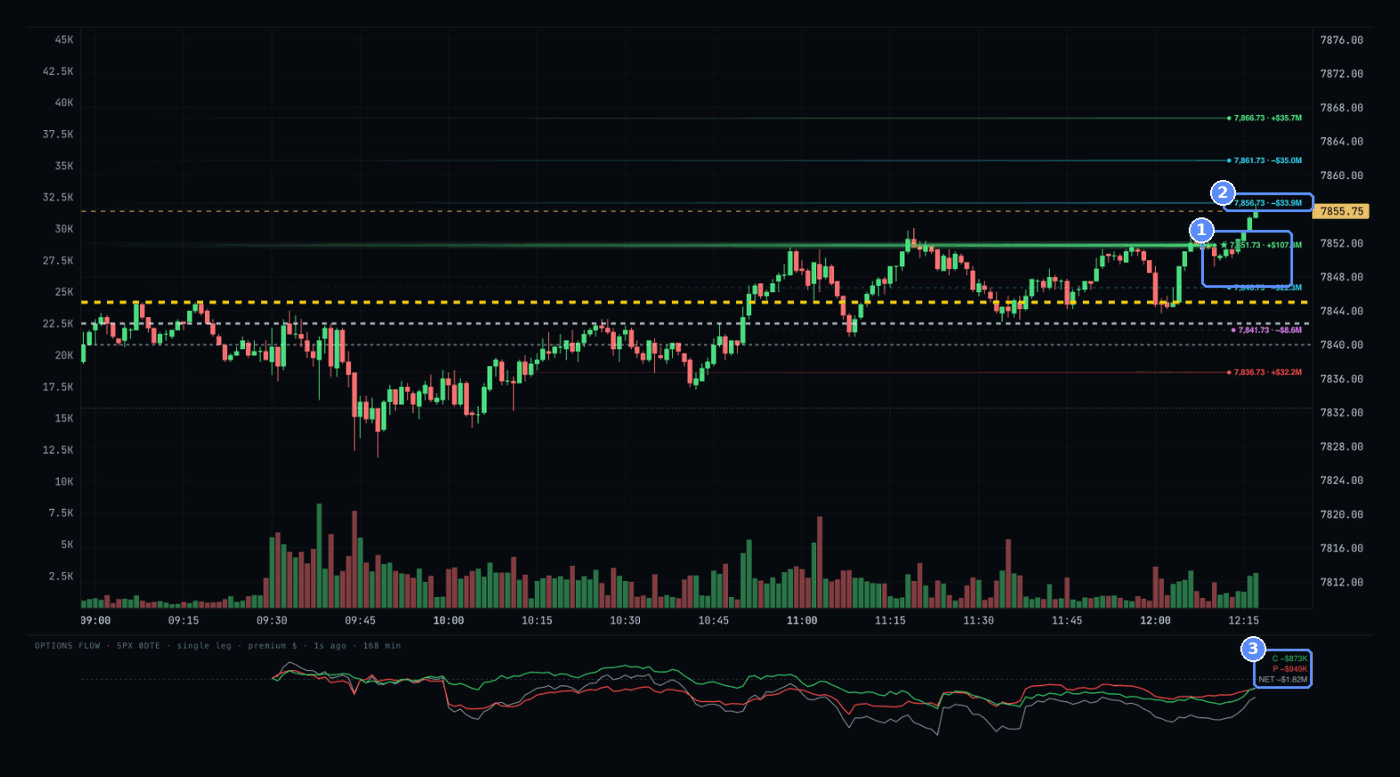
- The break. Candles close above the main Wall.
- The next level. 7,856.73 · −$33.9M, call short gamma.
- Flow. C −$873K · P −$949K · NET −$1.82M: the 0DTE options balance is still negative.
The overall read. All morning price worked between a flow support at 7,845 and a positioning resistance at 7,851.73, in a long gamma regime that absorbed moves. When the resistance gave way, price moved quickly toward the first short gamma Wall, as Market Intelligence’s scenario described, while Flow stayed negative: a note of caution on whether the break holds. It is a teaching read, not a trading signal.
The core rule
DO NOT READ ANY DATA POINT IN ISOLATION
A Dealer Wall identifies a potentially important level. The flow shows how the market behaves when it reaches that level. When several independent pieces of information converge on the same area, the read becomes more complete.
- A Wall shows where exposure concentrates, not what price will do.
- Block Prints and CVD tell you whether there is real activity in that area and on which side.
- No combination is a guaranteed signal: convergence makes the read more complete, not certain.