
CVDCumulative Volume Delta
CVD looks at buying and selling pressure in the underlying.
Three tools. Three perspectives on market activity.
CVD, CDI and Flow analyze different components of the market. CVD looks at buying and selling pressure in the underlying. CDI and Flow analyze options activity, through different measures.
They do not have to move in the same direction. Their value comes from comparing them with price, the Dealer Walls and the overall session context.
- Turn on CVD in the ACTIVITY group: the pane appears below the chart.
- Read the current value in the header, for example CVD −926 contracts, and in the tag on the right. On hover the header shows the time and value at that point, for example CVD 11:07 ET · −1.78K.
- Compare the highs and lows of price with those of CVD over the same period.
- Remember that CVD is available on futures, SPY, QQQ and BTC, not on SPX and VIX.
- Close the pane with the × in the header or with the same switch.
Price and CVD on ES on 9 October, from 08:55 to 12:15 ET.
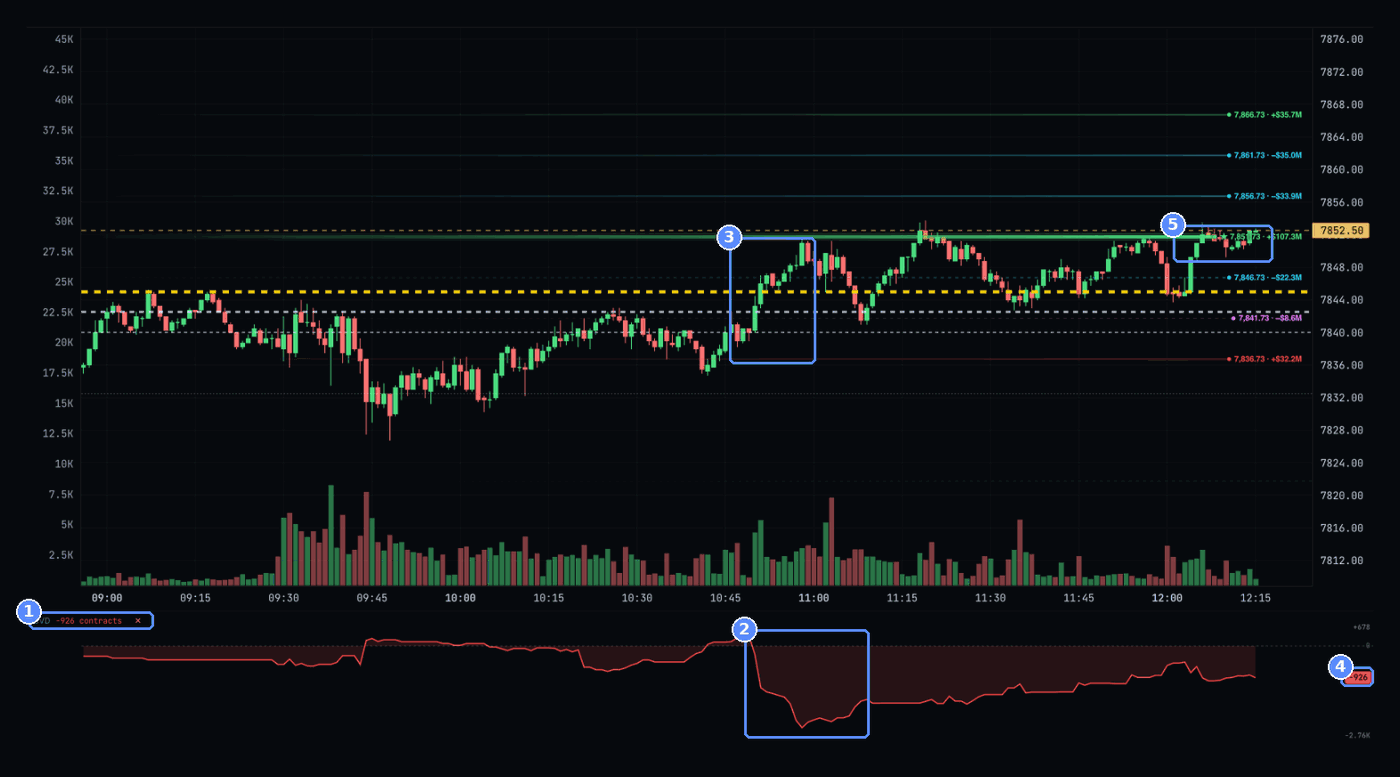
- Header. CVD −926 contracts: the cumulative balance between contracts bought and sold aggressively.
- The 10:52 drop. In a few minutes CVD goes from about +500 to about −2,700 contracts, the low of the day.
- Price at the same time. It rises from 7,838 to 7,850 and breaks above 7,845.
- The current value. The tag on the right shows −926.
- Price at 12:15. Back on the main Wall, around 7,852, with CVD still well below its 10:50 level.
How to read it. At 10:52 price rose while aggressive selling increased: a divergence. One possible read is that the selling was absorbed by larger passive buyers, consistent with the 484 contract mega block in the same minute and with 7,845 turning into support. From 11:00 CVD recovers about 1,800 contracts while price holds between 7,841 and 7,853. It is not a signal: it is one more piece of information on the quality of the move.
| PANE | WHAT IT OBSERVES | UNITS | AVAILABILITY |
|---|---|---|---|
| CVD | Aggressive buying minus selling in the underlying | contracts or shares | futures, SPY, QQQ |
| CDI | Single-leg 0DTE options activity | 0DTE premium | SPX, ES, MES, SPY |
| FLOW | 0DTE options premium, cumulative by side | dollars of premium | SPX, ES, MES, SPY |
CVDCumulative Volume Delta
What it is. The running total of volume traded as aggressive buying minus aggressive selling. On ES, MES, NQ, RTY, GOLD and BTC the buy or sell side is assigned by the exchange; on VX it comes from the data feed. Every trade with a buy or sell flag counts, at any size; trades with no flag are skipped. The line restarts at zero each New York day and does not depend on the BLOCK PRINTS minimum sizes.
How to read it. A rising line shows aggressive buying prevailing, a falling line aggressive selling. The scale fits the visible part of the chart: what matters is the shape against price, not the height.
How to use it. Compare CVD with price. If price makes a new extreme and CVD does not follow, the move is not confirmed by aggressive pressure. CVD is not available on SPX or VIX: an index has no trades of its own.
- CVD measures initiative, the difference between aggressive buying and selling, not total volume.
- A divergence means the move is not confirmed by the observed flow: it is not a reversal signal.
- CVD is not available on SPX and VIX: an index has no trade tape of its own.