
Block PrintsInstitutional trades on the chart
Block Prints shows on the chart the large trades typical of institutional players, and the price levels where they concentrate.
Block Prints highlights every trade above the minimum size you set: the large orders executed by funds, banks and other institutional players. For each block it shows the side, buy or sell, and marks the price levels where blocks accumulate.
When many blocks concentrate at the same price a key level forms: an area where institutional money committed, which can act as support if price retests it from above, or as resistance if it retests it from below.
The panel
The BLOCK PRINTS name opens its panel, in two parts: PRINTS for single trades, with its Minimum size, and PRICE LEVELS for the prices where trades stack up, with its Strength.
How to use it
- Watch whether blocks and bars cluster near a Dealer Wall or a Key Level.
- Compare the ribbon’s classification with how price behaves in that area.
- Use PRINTS · Minimum size to filter single trades and PRICE LEVELS · Strength to filter the levels. A stronger setting reduces noise and shows only the most relevant activity.
- Start with Key. Move to More or All when you want more context around price.
Block Prints on ES with the trades minimum size at 100 contracts: only large trades stay on the chart. The panel:
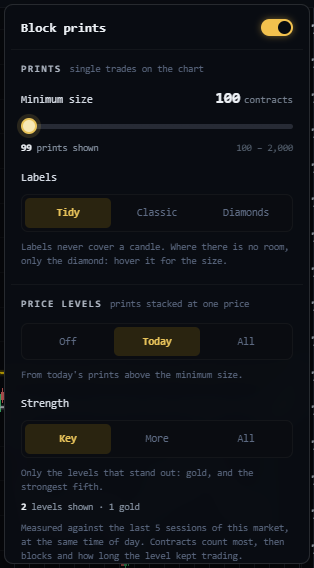
- Switch. Turns ribbon, blocks and levels on or off.
- PRINTS. 100 contracts: only trades of at least 100 contracts are drawn. 99 prints shown counts those on the chart.
- Labels. Tidy: labels never cover a candle.
- PRICE LEVELS. Today: the levels of the current session; the line underneath says what the mode shows. All adds those of previous days.
- Strength. Key: only the gold levels and the strongest fifth. 2 levels shown · 1 gold counts them, and the line under it says what they are measured against.
The chart with the blocks and levels of the morning of 9 October:
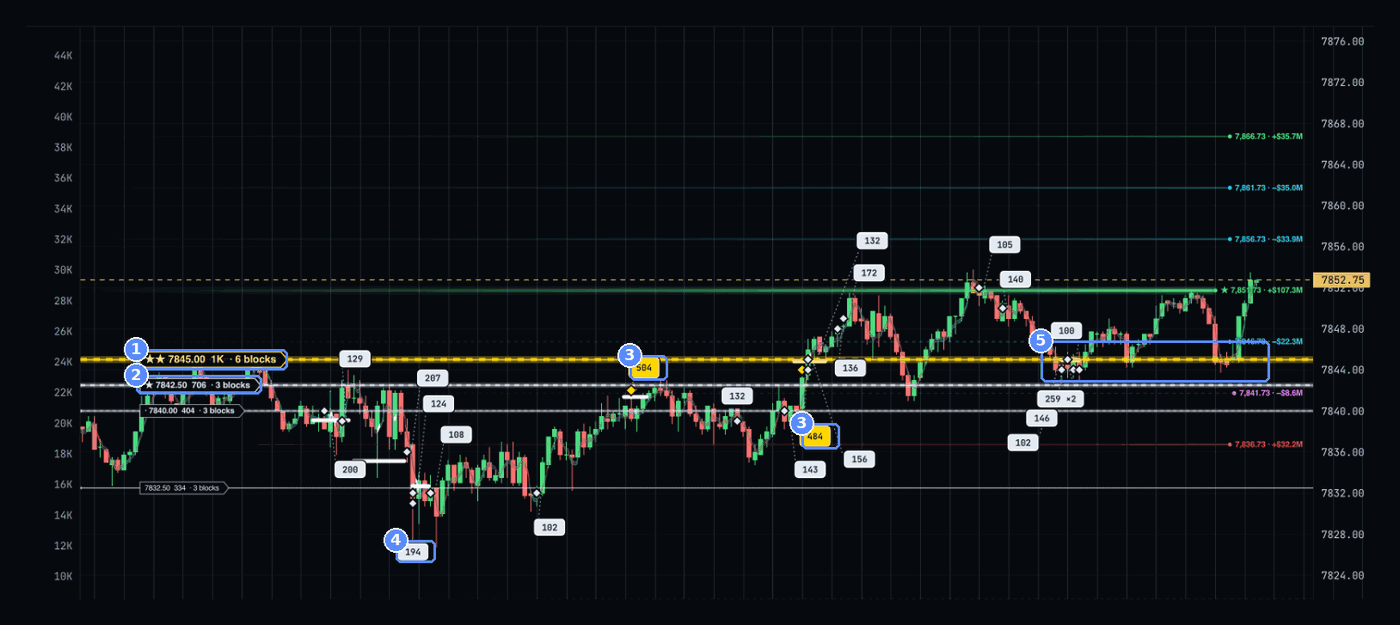
- Gold level. ★★ 7845.00 1K · 6 blocks: the price with the most volume traded in the session, over 1,000 contracts in 6 blocks.
- Silver level. ★ 7842.50 706 · 3 blocks. Further down 7840.00 404 · 3 blocks and 7832.50 334 · 3 blocks.
- Mega blocks. The amber tags: 504 contracts at 10:21 and 484 at 10:52, on the candle that took price above 7,845.
- Single blocks. The white tags show the contracts in each block, for example 194 at 09:44, at the morning low.
- Back on the level. At 11:35 and 11:58 price came back to 7,845 and bounced.
Hovering the level label opens its card:
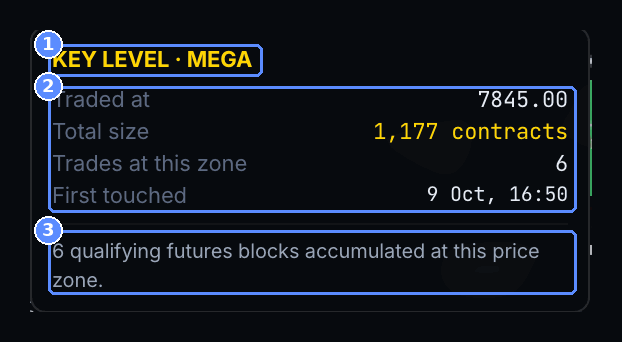
- Type. KEY LEVEL · MEGA: the most important level of the session.
- Data. Price 7845.00, 1,177 contracts in 6 trades, first touched 9 Oct, 16:50. That time is in the computer’s time zone, not ET: 16:50 in Italy is 10:50 ET.
- Description. 6 futures blocks accumulated in this price zone.
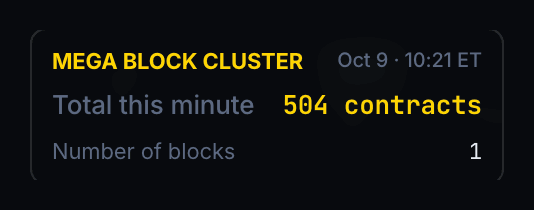
On a single mega block the card shows minute, contracts and number of blocks:
Hovering the ribbon opens the activity card for that moment instead:
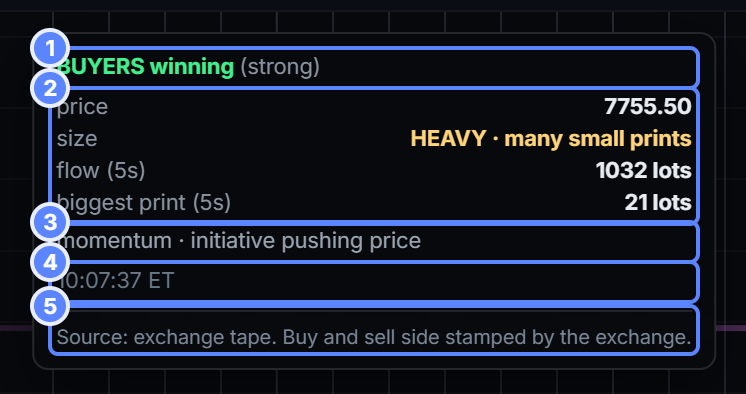
- Prevailing side. BUYERS winning (strong): buying prevails, with strong intensity. The intensity is never higher than the flow in the same card.
- Data for the moment. Price 7755.50, size HEAVY · many small prints, 1032 lots in the last 5 seconds, biggest trade 21 lots: heavy flow made of small trades, none of them a block.
- Momentum. initiative pushing price: one side is ahead and the flow is pushing price.
- Time. 10:07:37 ET.
- Source. The exchange tape; on ES the side is assigned by the exchange.
How to read it. 7,845 is the price where institutions traded the most during the morning, including the 484 contract block that came with the 10:52 breakout. Since then price has come back to the level twice and held both times: for now 7,845 is working as support. Above, the 7,851.73 Wall is acting as resistance. The morning played out between a support built by institutional flow and a resistance built by dealer positioning.
Reading the elements
The hover cards
Block Prints and Dark PoolTwo different sources
Block Prints and Dark Pool are not synonyms. The trades shown by Block Prints come from different sources depending on the instrument.
Off-exchange executions on stocks and ETFs and exchange transactions on futures therefore come from different sources and do not represent the same data.
Availability
Every future (ES, MES, NQ, RTY, VX, GOLD, BTC), SPY, and SPX using the ES tape. Not available on VIX or QQQ: the control is dimmed and says why. On lower-volume instruments the ribbon is naturally sparser: the classification is relative to each market.
- A white bar flags a liquidity event, not a reversal.
- The read becomes more complete when the event coincides with a Dealer Wall or a Key Level.