
Market IntelligenceA structured read of the market
Market Intelligence organizes dealer positioning and the key levels in a single panel.
The goal is to help you understand the session context without reading every Wall and every metric separately. The panel shows positioning, the main levels, possible scenarios and the conditions that can change the read.
- Click MARKET INTELLIGENCE at the top right: the panel opens next to the chart, which narrows and stays usable.
- Read the sections top to bottom: Dealer positioning, Key strikes, Break scenarios, Invalidation, Gamma by strike.
- Compare the Key strikes with the Walls drawn on the chart.
- Change METRIC in the bar: the panel updates and describes positioning for the chosen metric.
- Close the panel with the same button.
The live panel at 12:06 ET on 9 October, during regular hours.
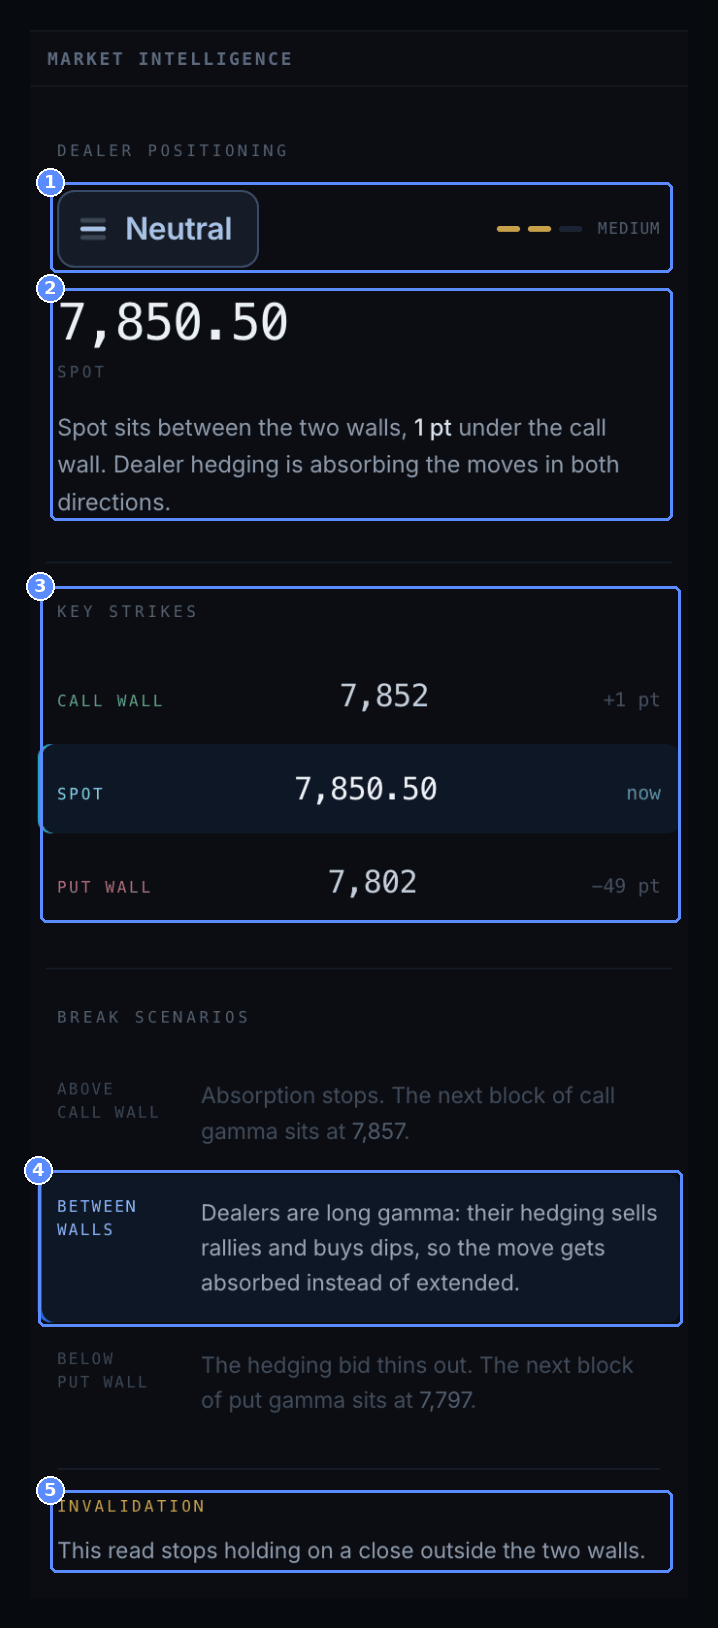
- Dealer positioning. Neutral with MEDIUM conviction, two notches out of three.
- Spot and description. 7,850.50: price sits between the two Walls, 1 point under the wall above, and hedging absorbs moves in both directions.
- Key strikes. WALL ABOVE 7,852 +1 pt, WALL BELOW 7,802 −49 pt. The wall above is the starred Wall on the chart, 7,851.73. On this 9 October capture the panel named the larger of the two Walls below, 7,802 (+$32.9M). It now names the nearest Wall on each side, so the same moment would show the red Wall at 7,836.73 (+$32.2M) as wall below.
- Current scenario. Between walls is highlighted: dealers long gamma, the move gets absorbed. Past the wall above, the next wall up is at 7,857; past the wall below, the next wall down is at 7,797.
- Invalidation. The read stops holding on a close outside the two Walls.
At the bottom of the panel, Gamma by strike lists every strike with its exposure:
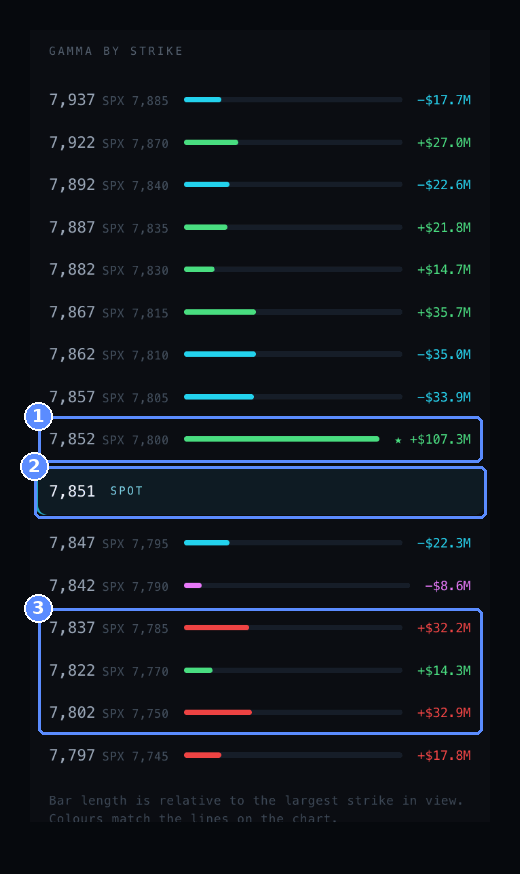
- The main Wall. 7,852 · SPX 7,800 · ★ +$107.3M: the longest bar.
- Spot. 7,851 SPOT: the highlighted row separates strikes above and below price.
- Below price. 7,837 +$32.2M, 7,822 +$14.3M, 7,802 +$32.9M: the colors match the lines on the chart.
How to read it. The panel confirms what the chart shows: price pressed under the wall above, dealers long gamma, medium conviction. The detail to watch is the scenario above: beyond 7,852 absorption stops and the next block is at 7,857, the cyan short gamma Wall seen in the Dealer Walls chapter.
How to read the panel
WHAT IT READS
Market Intelligence reads the dealer book and price. Block Prints, CVD, CDI and Flow are not part of its read. WALLS does not change the reading: it only changes how many Walls are drawn and listed under Gamma by strike.
IT FOLLOWS THE METRIC
The panel is based on the METRIC selected in the bar. Switching from GEX to CEX or DEX changes the key levels, the scenarios and the list by strike. With ALL the scenarios read the GEX Walls.
TWO SCALES, ONE LEVEL
On ES prices are shown on the futures scale, with the SPX strike they come from: they refer to the same level. Each level is placed on the nearest ES price (steps of 0.25), so the panel, the label on the chart and the Wall card show the same number.
- Market Intelligence is an interpretation tool, not an automated execution system.
- It organizes positioning and scenarios to help you read the market.
- Confirmation comes from how price actually behaves and from the other data.