
Launch exclusive

Your first month. Just $1

Get Access
Skip to content
TERMINAL GUIDE

How to read Volwick

Open in the terminal

Exposure Maps

Exposure Maps show how dealer exposure changes in relation to price and time. Each map represents a different component of options positioning.

CHAPTER VIDEOExposure MapsLength 1:57

In this chapter you learn to read Volwick’s five heat maps: how they are built, what the colors represent and how to use them with the Dealer Walls to see how positioning changes during the session.

How to use it

How to use it

  • Pick one map at a time from the MAPS menu, based on what you want to observe.
  • Compare the color areas with the Dealer Walls and with where price is.
  • Watch how the areas change through the session, especially near the points where the sign changes.

TWO NOTES

The color scale is computed over the whole session: a morning column can re-shade when higher values arrive. The point where the Gamma map changes sign and the one on the Delta map are two different levels.

Real example
Terminal screenshot · 9 October 2026 session on ESThe values on your chart will differ: what matters is how you read them.

Gamma map on ES, morning of 9 October, during regular hours.
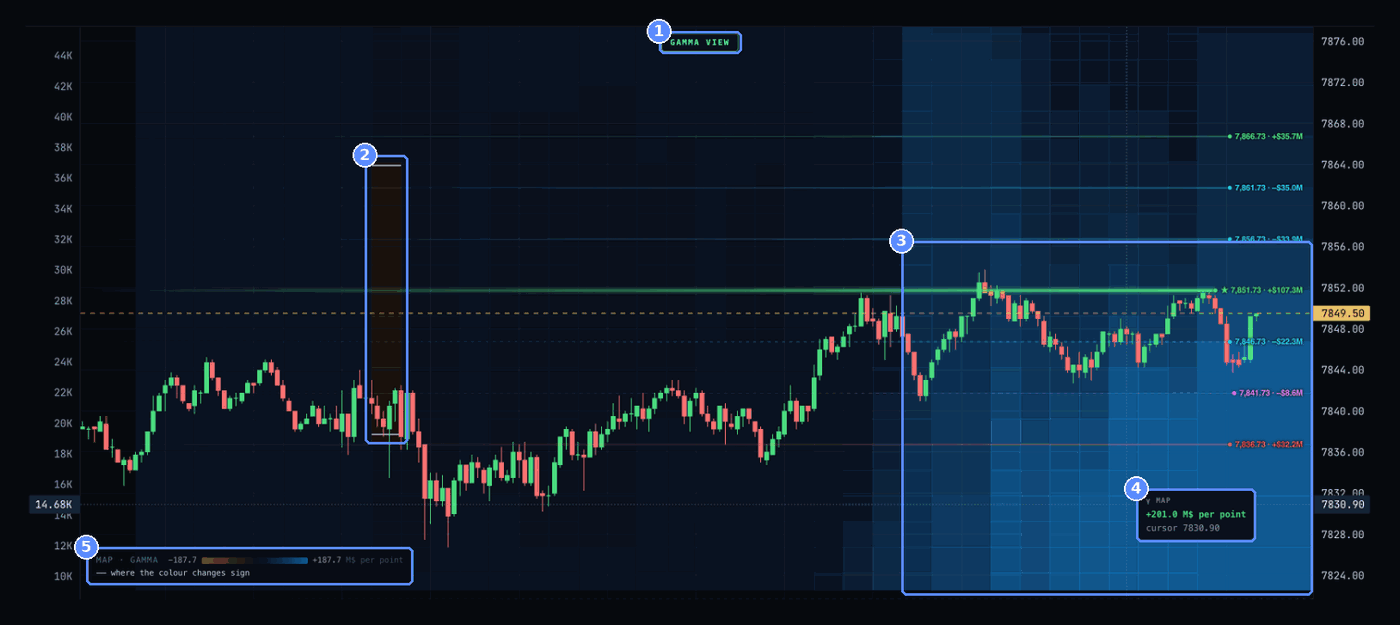
Live terminal · ES · 9 October 2026, regular hours, between 12:03 and 12:18 ET.
  1. The active map. GAMMA VIEW: the badge at the top shows which map is on.
  2. Sign change. Between 09:35 and 09:40 an amber column appears: for a few minutes exposure near price was negative. The white dashes mark the price where the color changes.
  3. The blue field. From 11:00 the blue deepens, especially below price, between 7,824 and 7,845.
  4. The exact value. On hover: γ MAP +201.0 M$ per point · cursor 7830.90.
  5. The legend. MAP · GAMMA −187.7 … +187.7 M$ per point: the color scale, from amber to blue.

With MAPS on Delta the badge becomes DELTA VIEW and the legend dealer hedge vs spot (blue = they BUY). The same morning the area above price was mostly amber and the area below mostly blue.

How to read it. From 11:00 a cushion of positive gamma built up below price and kept deepening, consistent with the dips toward 7,841 and 7,843 being absorbed through the morning. The 09:35 amber column comes just before the most nervous part of the open, with price falling to 7,828 at 09:45. The map shows how exposure changes, not where price will go.

Technical explanation

On screen

  • The vertical axis is price.
  • The horizontal axis is time: each column is a snapshot of the book every 5 minutes.
  • Colors show the side of the selected metric and its size.

Maps let you see how these exposures are distributed and how they change through the session.

Example Gamma map. White ticks mark where the value changes sign.

How to read it

Blue and amber
Blue is the calm or supportive side of the metric, amber the pressure or amplifying side. On Gamma, Vega and Volga blue means positive values; on Charm and Delta the color follows the dealer hedge, so a blue cell can show a negative number. Color intensity shows size against the session’s own range. The terminal uses blue and amber, not green and red, so maps are never confused with candle colors.
Legend
Bottom left, for example MAP · GAMMA −198.0 … +198.0 M$ per point, with the line marking where the color changes sign. On the Delta map the legend reads dealer hedge vs spot (blue = they BUY).
Badge and cursor
The active map’s name appears top center, for example GAMMA VIEW. Hover to read the exact value and the cursor price, which is not a traded price.

The five maps

Gammastability and acceleration
Shows the distribution of gamma exposure. Helps find areas where dealer hedging can dampen or amplify price moves. Blue: dealers are long gamma, their hedging sells rallies and buys dips (dampens). Amber: short gamma, hedging chases the move (amplifies).
Charmthe effect of time
Shows how option delta changes as time passes. Particularly useful near expiry, when time decay can change hedging needs faster. Blue: the passing of time forces dealers to buy (supportive). Amber: it forces them to sell (pressure).
Vegasensitivity to volatility
Shows dealer exposure to changes in implied volatility. Helps find areas where a change in volatility can have a larger impact on positions. Blue: dealers are net long volatility and sell it into a spike (calms it). Amber: net short, they buy into it (amplifies). Not directional.
Volgasensitivity of Vega
Measures how Vega changes as implied volatility moves. Shows where sensitivity to volatility can increase or decrease. Blue: as volatility rises dealers get longer vol and sell (self-correcting). Amber: they get shorter and must buy more (cascade). Amber Vega plus amber Volga is the most fragile combination.
Deltadirectional exposure
Shows the distribution of delta exposure across price levels. Helps understand how dealer hedging needs can change as the underlying moves. Blue: to reach that price dealers must buy futures. Amber: they must sell.
Key points
  • Each map measures a different component.
  • A color should not be read automatically as a bullish or bearish signal: the read depends on the selected metric and on Volwick’s sign convention.