
The gamma regime
The gamma regime describes how dealer positioning can influence volatility and price behavior.
Knowing the regime helps separate conditions that may favor contained moves from conditions where the market may accelerate.
- Pick an instrument with a signed book: SPX, ES, MES, VIX or VX.
- Set METRIC to GEX.
- Look at the color of the Walls nearest to price: green and red are long gamma, cyan and magenta short gamma.
- Open MARKET INTELLIGENCE and read Dealer positioning: verdict, conviction and highlighted scenario.
- Turn on MAPS Gamma to see where exposure is positive, in blue, or negative, in amber. Check again during the session: the regime can change when price moves or the book updates.
ES at 12:05 ET on 9 October. Price was working between two long gamma Walls: ★ 7,851.73 · +$107.3M, green, above and 7,836.73 · +$32.2M, red, below. In between only two small short gamma Walls: 7,846.73 · −$22.3M cyan and 7,841.73 · −$8.6M magenta.
Market Intelligence summed it up as Neutral, MEDIUM conviction, with this scenario highlighted:
Dealers are long gamma: their hedging sells rallies and buys dips, so the move gets absorbed instead of extended.
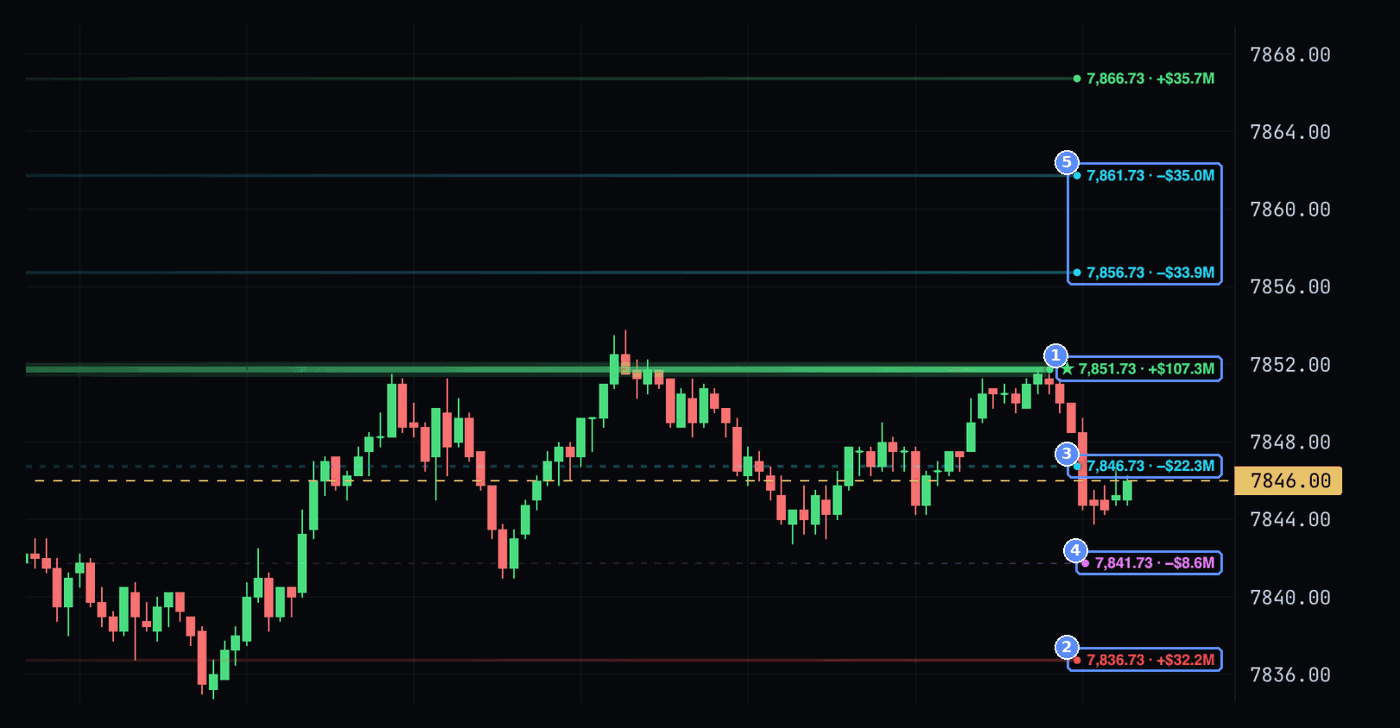
- Above. ★ 7,851.73 · +$107.3M: green Wall, long gamma, the largest on the map.
- Below. 7,836.73 · +$32.2M: red Wall, long gamma.
- In between. 7,846.73 · −$22.3M: cyan Wall, short gamma, small.
- In between. 7,841.73 · −$8.6M: magenta Wall, short gamma, even smaller.
- Above the main Wall. 7,856.73 and 7,861.73: two cyan short gamma Walls, where the regime changes.
The same picture in Market Intelligence, in the scenarios section:
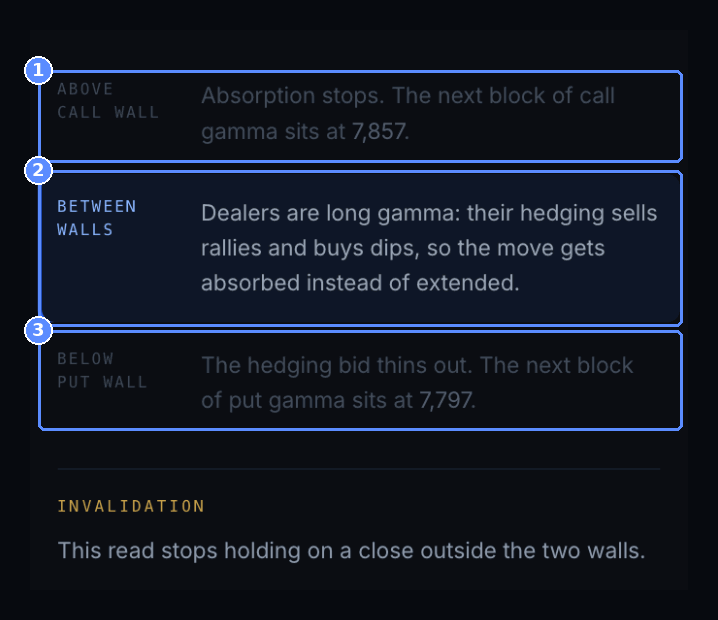
- Above 7,852. Past the wall above, absorption stops.
- Between walls. The highlighted scenario: dealers are long gamma and the move gets absorbed.
- Below 7,802. Past the wall below, hedging stops supporting price.
How to read it. A long gamma regime around price. It fits a morning of swings between 7,836 and 7,853, with rallies rejected under the main Wall and dips toward 7,841 absorbed. Above 7,851.73 the picture changes: the cyan Walls at 7,856.73 and 7,861.73 are short gamma, so in that area sensitivity to directional moves increases.
POSITIVE GAMMA
When dealers are net long gamma, their hedging tends, all else equal, to counter price moves. This can favor more contained swings and moves back toward certain areas. Read: higher likelihood of stabilizing behavior.
NEGATIVE GAMMA
When dealers are net short gamma, their hedging can amplify price moves. This can favor acceleration, level breaks and higher volatility. Read: greater sensitivity to directional moves.
How to read it
AVAILABILITY
The regime is read on a signed book: SPX, ES, MES, VIX and VX. On SPY, QQQ, NQ, RTY, GOLD and BTC the Walls are open interest estimates and their color should be read with more caution. The regime can change during the session: check it again when the book updates.
- The same Dealer Wall can mean something different depending on the gamma regime.
- Before reading a level, check the regime and watch how price behaves near the Wall.